
I'm building a "dashboard" in SSRS that updates every minute to show the results of a particular horse race. One area on the page displays a bar chart as below.
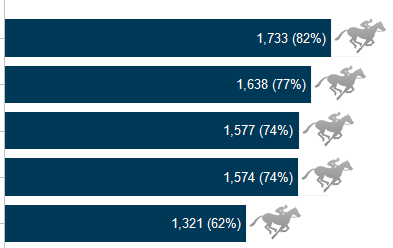
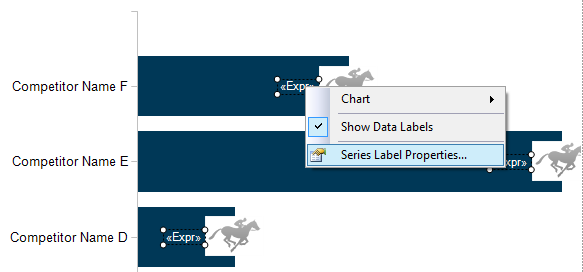
I needed to display the number as a data label (which was simple enough) but I further needed to show the percentage of the total in the same label. To achieve this you need to first right click the series in your chart and select Show Data Labels before clicking Series Label Properties.
Now write a custom expression for the label data, adding the field and the percentage calculation as you need. The screenshot below shows my expression which includes formatting the first number to have a thousands comma and the second number calculated against another dataset, rounded to two decimal places, multiplied by 100 with a % symbol to represent percent of total.
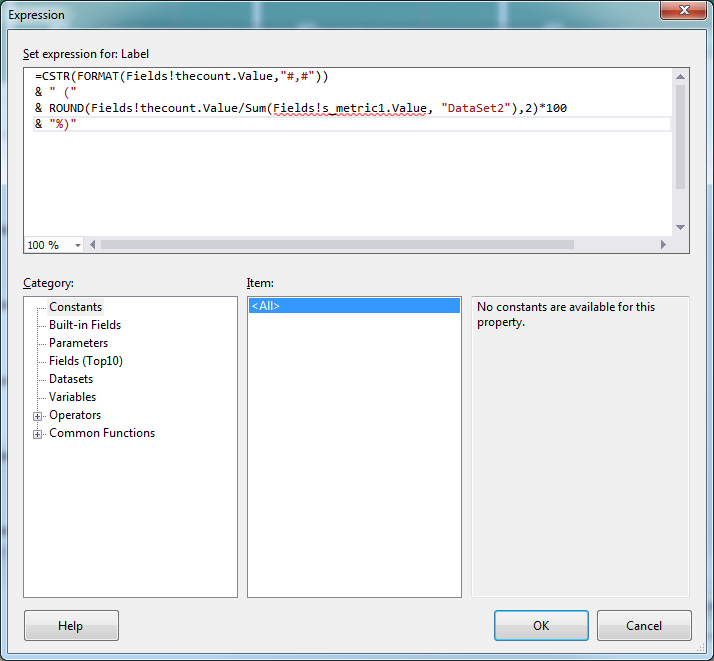
=CSTR(FORMAT(Fields.thecount.Value,"#,#"))
 & " ("
 & ROUND(Fields!thecount.Value
   / SUM(Fields!s_metric1.Value, "DataSet2"),2)*100
 & "%)"
I hope this helps!